
Q3 2021 Remains a Seller's Market: Inventory at All-Time Lows, Prices Rise to Meet Demand
Hawaii Island Market Statistics Overview
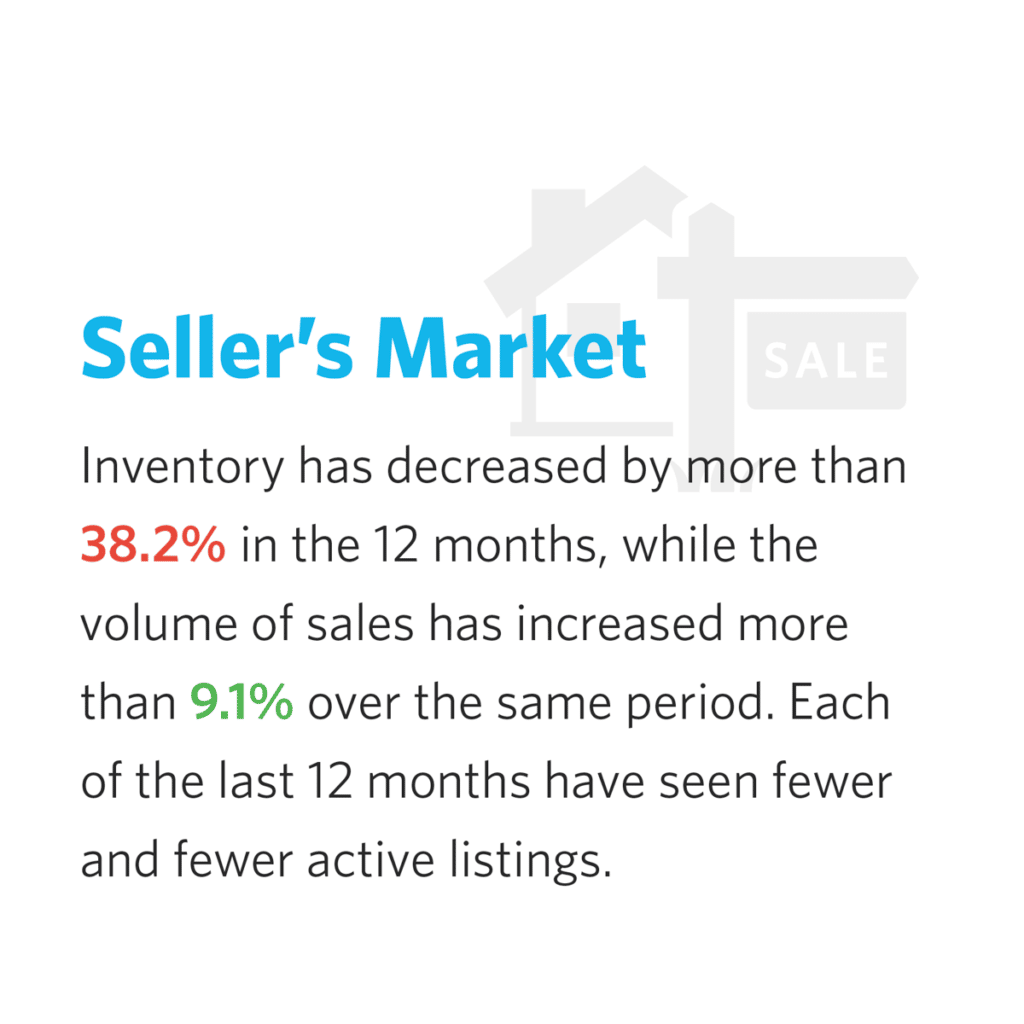
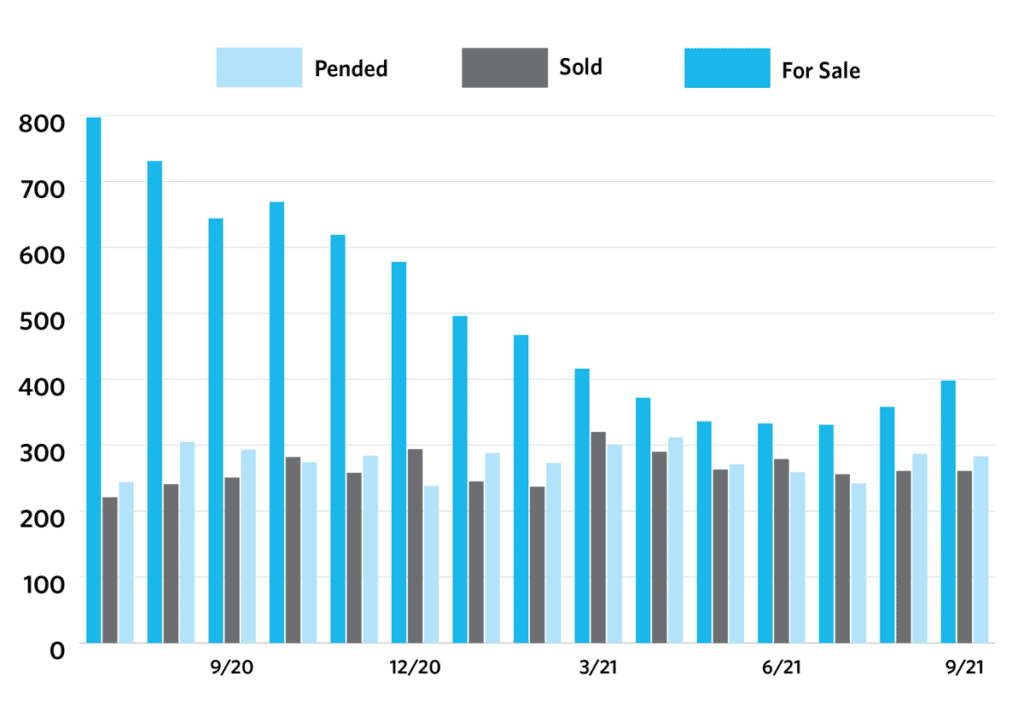
Inventory
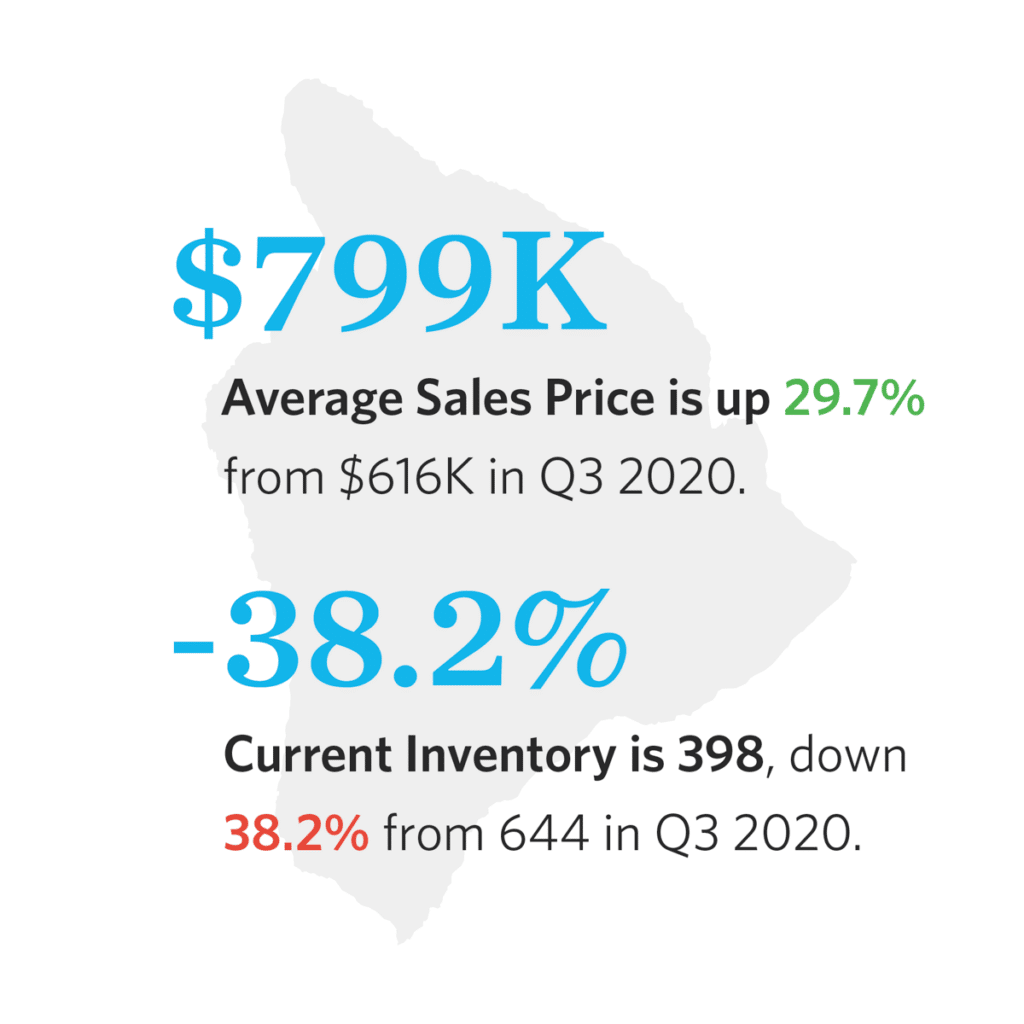
There are currently 398 active residential listings on Hawai‘i Island, a decrease of -38.2% comparing Q3 2021 to Q3 2020. Number of homes available for sale have dramatically decreased when comparing Q3 2021 to Q3 2020.
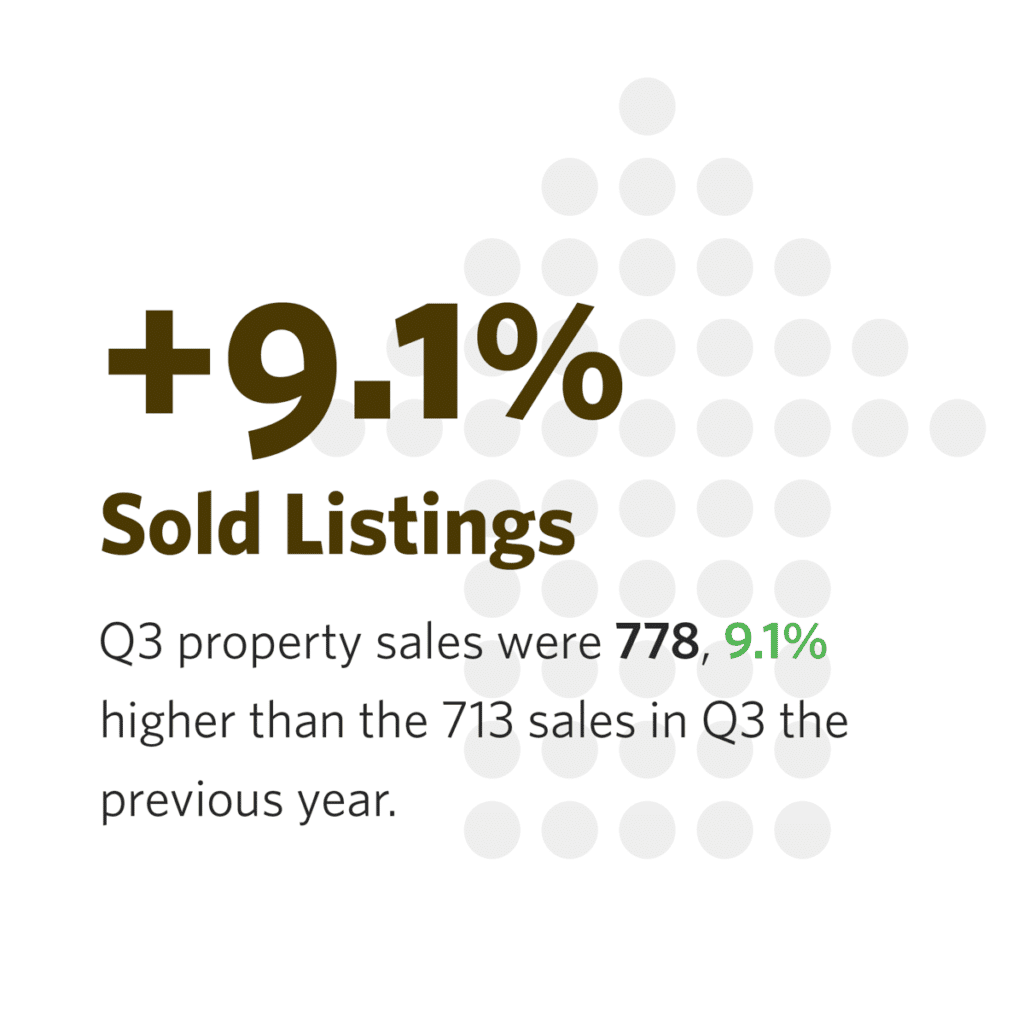
There were 778 sales on Hawai‘i Island in Q3 2021, an increase of +9.1% over 713 sales in Q3 2020.
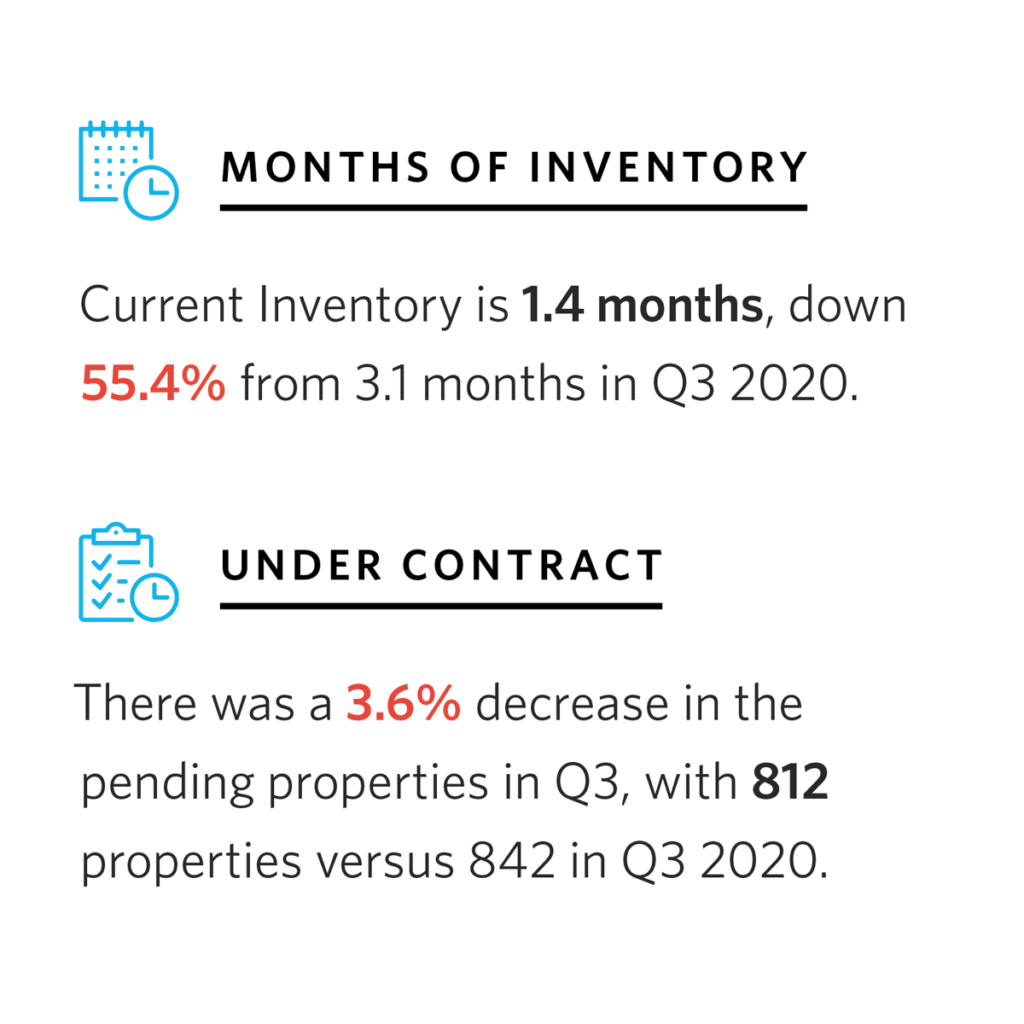
Homes under contract are currently 812, a decrease of -3.6% over the same period last year, in which 842 homes were under contract in Q3 2020.
On Hawaii Island, the rate of inventory decline is increasing.
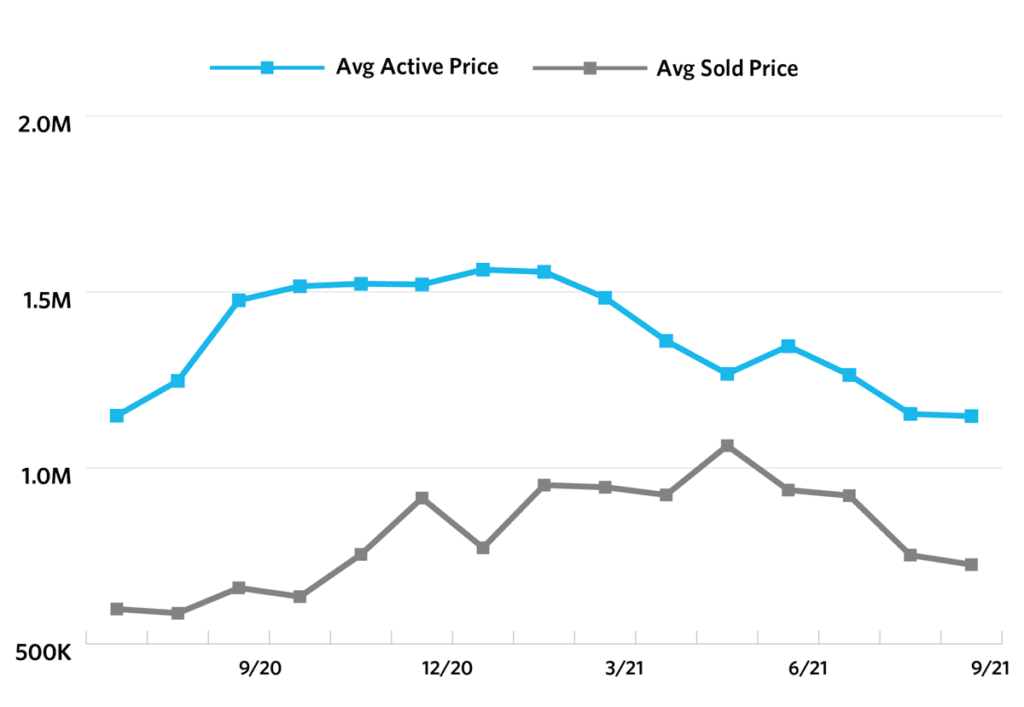
Average Sales Price
For the third quarter of 2021, the average sales price of single family homes on Hawai‘i Island was $799K, an increase of +29.7% over the average sales price of $616K during Q3 2020.
Prices are rising quickly as inventory continues its dramatic downward trend.
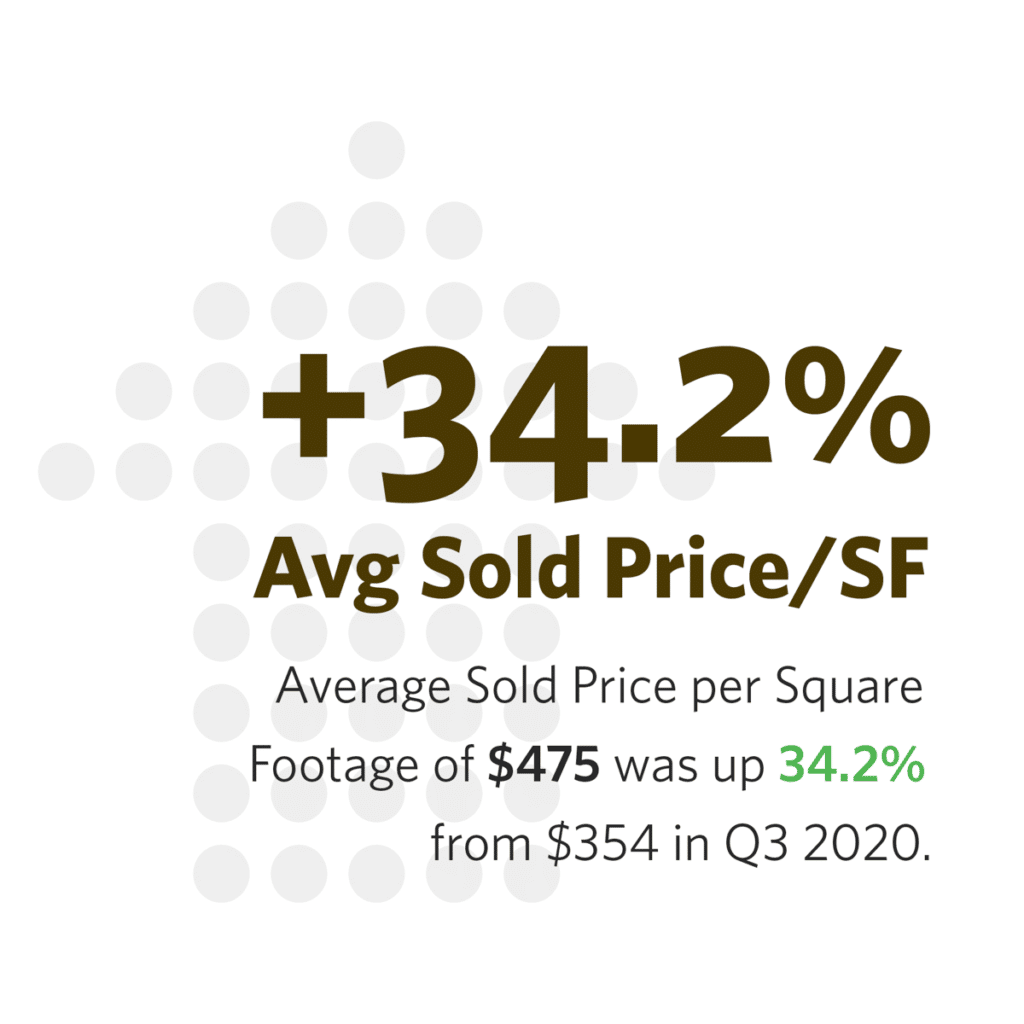
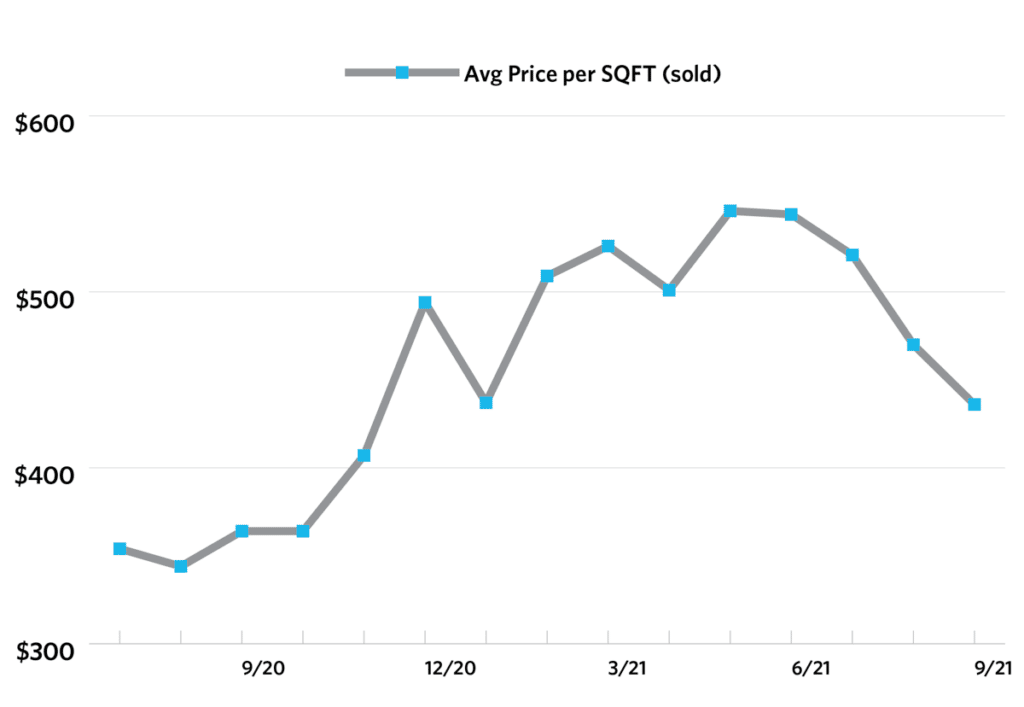
Average Price Per Square Foot
Since Median Sold Price and Average Sold Price can be impacted by the mix of high or low end properties in the market, the Average Sold Price per Square Footage is a more normalized indicator on the direction of property values.
For Hawaii Island, the average price per square foot has shown a steady increase over the last 12 months, with the year over year increase growing to $475.38/foot at the end of September 2021, an increase of +34.2% comparing Q3 2021 to Q3 2020.
Residential properties are commanding more value per square foot.
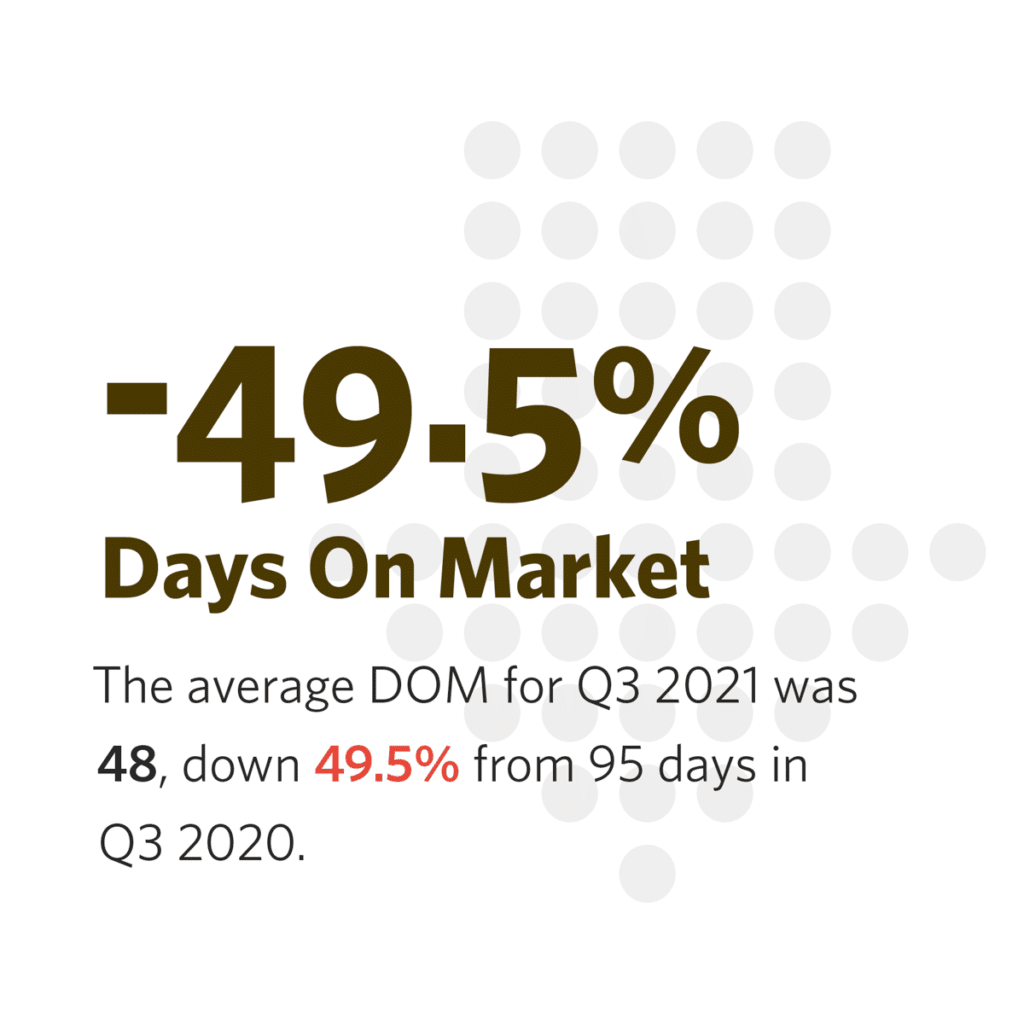
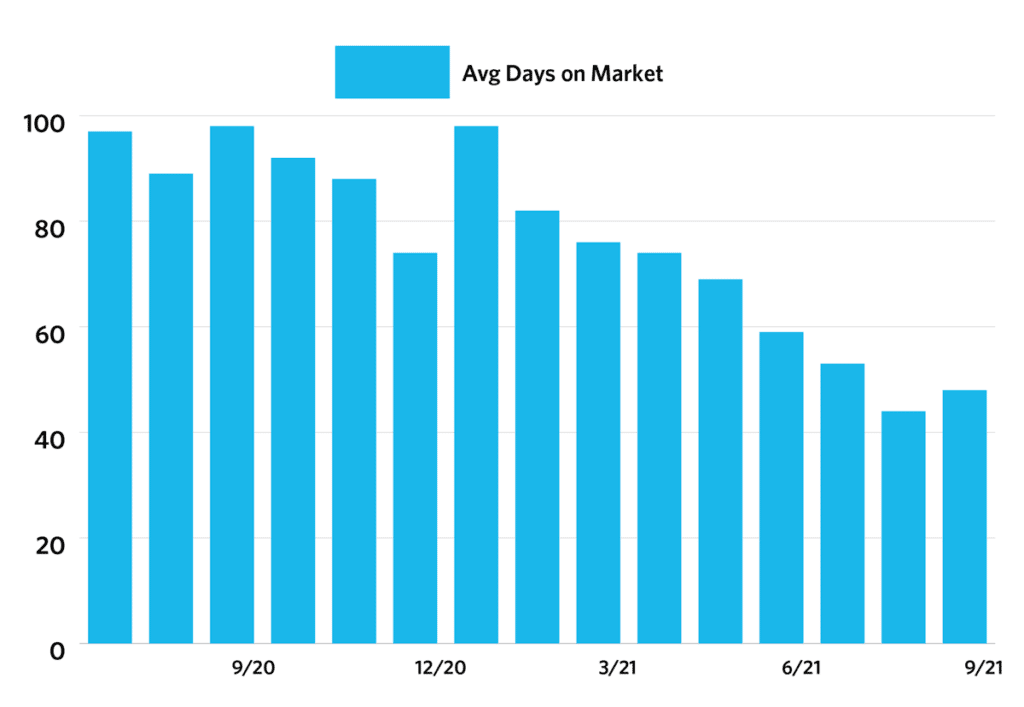
Days on Market
The average Days on Market (DOM) shows how many days the average property is on the market before it sells. The downward trend indicates a move towards more of a Seller’s market. While some of the previous 12 months have been outliers, the overall trendline shows that Days on Market is decreasing. Q3 2021 reported an average number of days on the market as 48 DOM, a decrease of -49.5% compared to 95 DOM Q3 2020.
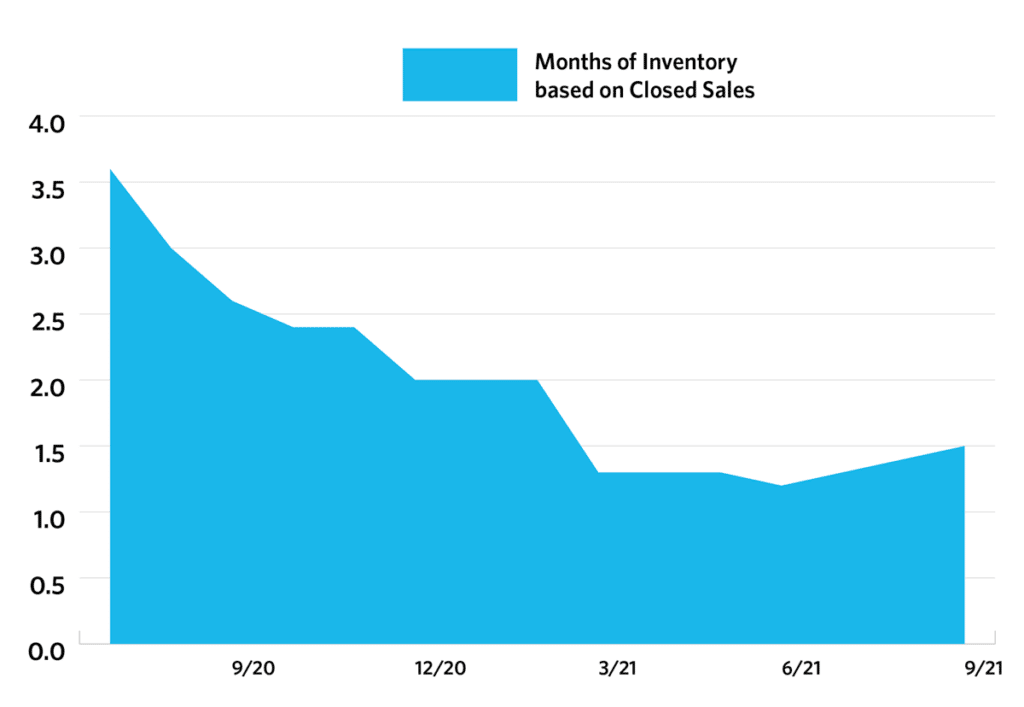
Months of Inventory
Current months of inventory available is 1.4 months, a decrease of -55.4% comparing Q3 2021 to 3.1 months in Q3 2020.
The real estate market on Hawaii Island is quickly running out of inventory.
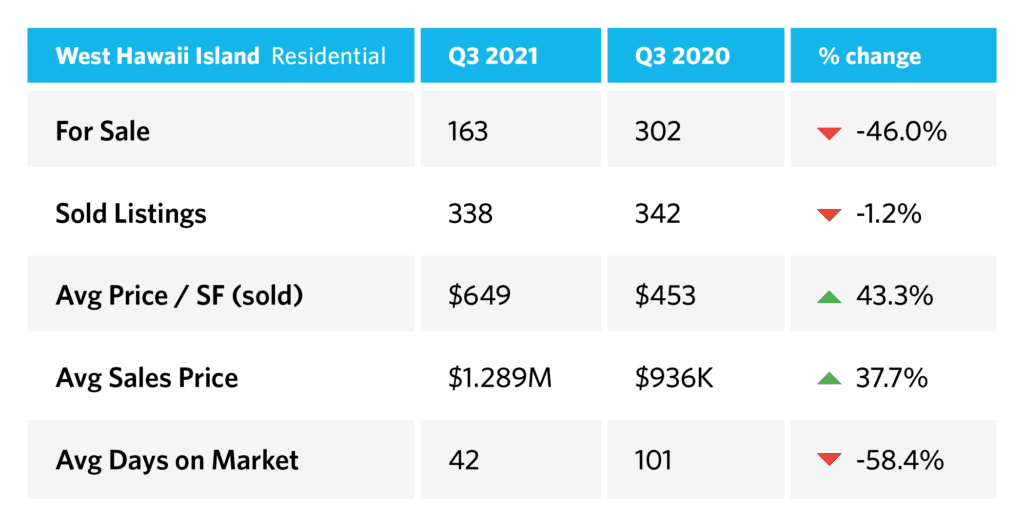
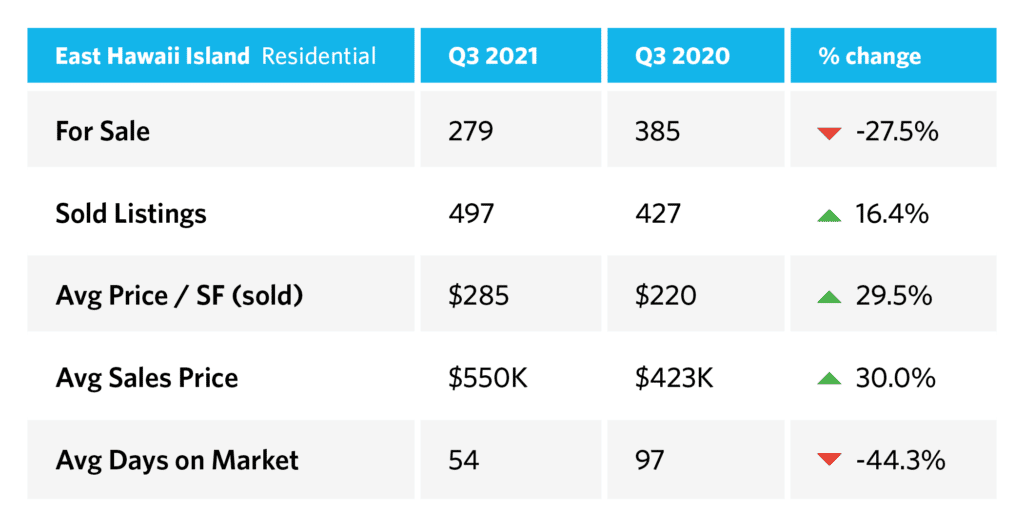
These snapshots give you an overview of the kind of activity we are seeing on the East and West sides of the Island. Contact us for details.
It's an exciting and complicated time in Hawaii real estate. We're here to help.
Contact us directly for real estate information.
